
Dr. Lawrence Yun visited Norwalk CT on May 22, last Wednesday, and gave the Realtors® of this area some insight into what the National Association of Realtors® (NAR) and their economists were thinking about the state of the market and economy at large. Dr. Yun is the Chief Economist for NAR, a lobby organization for Realtors® . In essence, he is the main spokesperson for the state of the real estate market across the country.
Here, I have summarized the presentation for our followers, or those who are curious about the state of the market, and that of the market in Connecticut. I have also given his conclusions, as well as my conclusions at the end of this (long) blog post.
Cutting to the conclusion, Dr. Yun has indicated that he doesn’t believe the real estate market will take a serious hit and doesn’t predict an economic recession, especially as hard-hitting as the 2008 recession. I believe that this analysis was done in a vacuum and doesn't factor in larger current events that will affect these conclusions.
Here is the presentation from my notes, with some of the slides as aids. Note that my commentary is in green.
The Presentation
Dr. Yun started by commenting on the positive news of the economy.
The United States has had the longest economic expansion ever as of July of this year, based on several months of GDP growth.
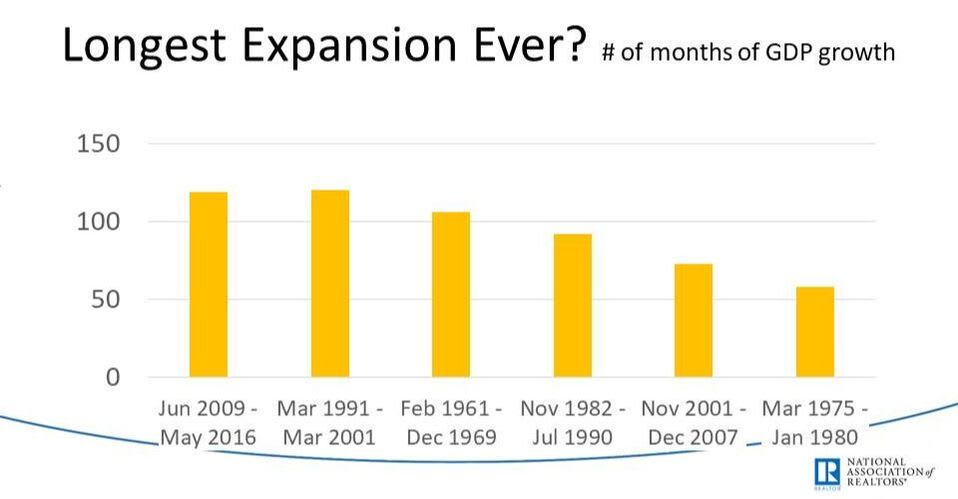
This graph shows the # of months of Gross Domestic Product Growth during the periods of the highest growth in America in our history of recording this data.
The inverted yield curve indicates a recession is around the corner when the fed rate exceeds 10 year U.S. treasury borrowing rate. I thought he concluded no recession, but the data says otherwise.
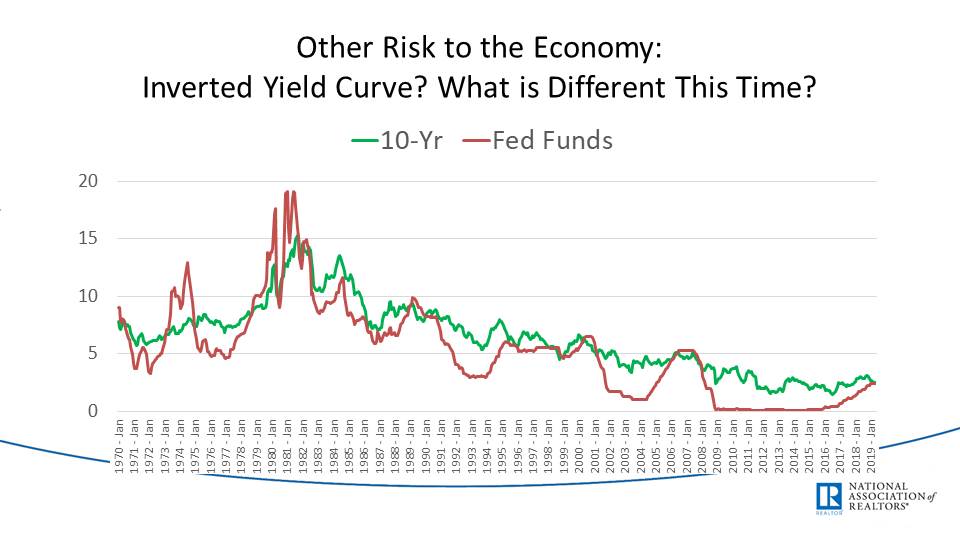
The interest rate on the vertical axis, this graph shows the historic trend of 10-year treasury notes versus the Federal Reserve rate or the interest rate for money borrowed from the government.
He comments that this inversion is happening in a low interest-rate environment, so these past predictors might not have that much weight in a unique economy. So because interest rates are at the lowest point in decades, we are comparing these models to those at a point where interest rates were incredibly high. I don't buy this, but I am also not as familiar with these trends as he might be; this is outside of my wheelhouse.
Let’s Look at Other Indicators:
Consumer confidence is exceptionally high. I like to see that consumers are confident in the market, but when will the economic, foreign, and political factors at play affect this sentiment?
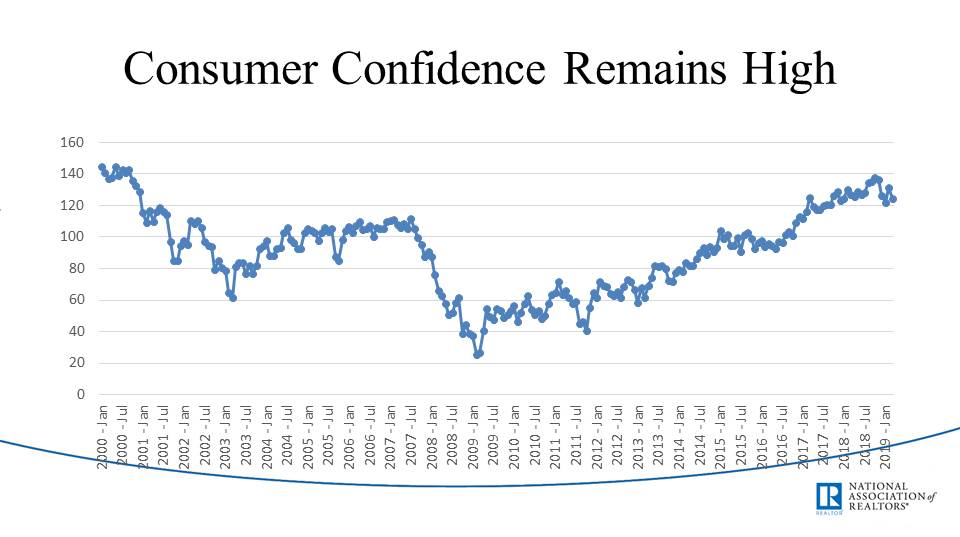
This shows consumer confidence as measured against historical benchmarks.
Job creation has risen steadily over the last few years. What kind of jobs are these? Are wages higher (see below)? Are they all full-time jobs with benefits?
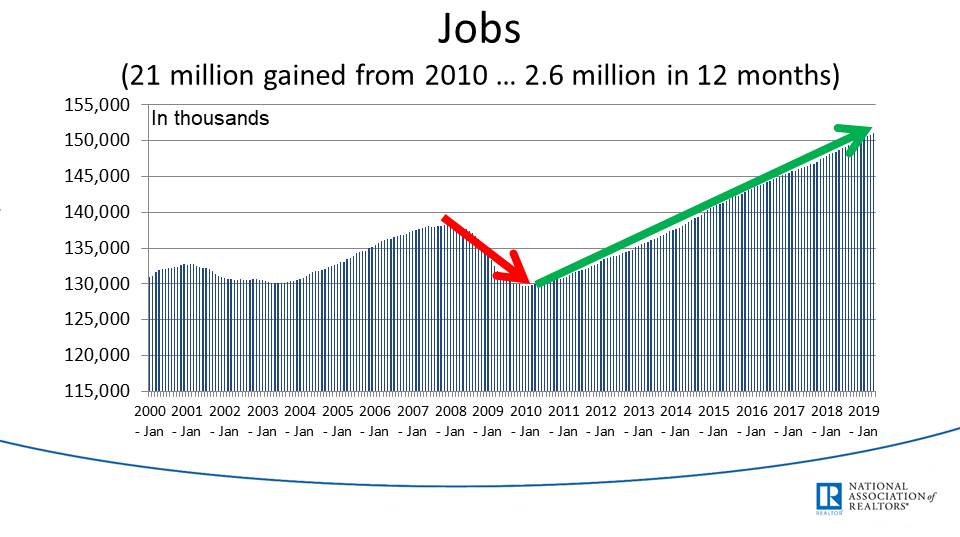
Total jobs in the United States over time.
Sinking affordability index, better than 2000. Because we are still above 2000 levels, Dr. Yun concludes that this is positive. But I see homes becoming less affordable, which cannot be a positive piece of data.
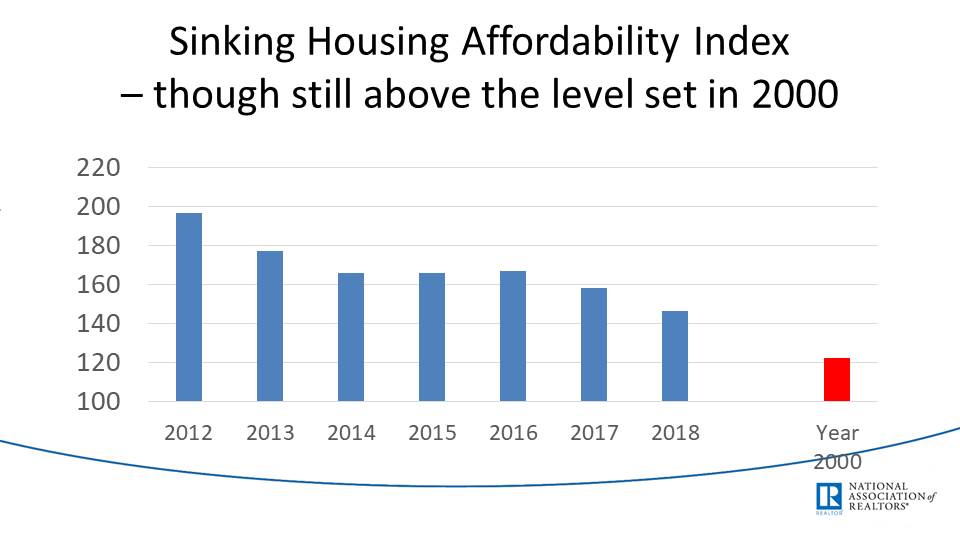
An index of 100 means that the family with a median income earns exactly the income needed to qualify to purchase the median-priced home. Higher than 100 says more income to buy a home, and less than 100 means less than enough income to buy.
The average hourly wage is increasing in the United States. I am pleased that the additional jobs are producing higher wages. Does this have to do with organic growth in the economy or regulations to increase hourly wages for workers across the country?
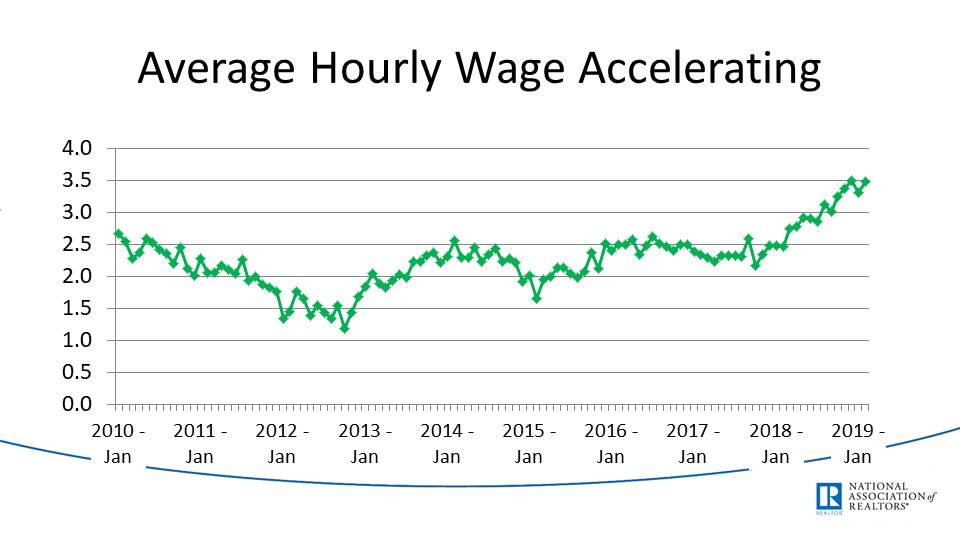
Although this follows actual data related to an average hourly wage, I am not sure what the vertical axis means, but the trends correlate to actual United States data. I assume these show percentage increases in wage growth.
Current unemployment figures are at 3.6/3.7%. Dr. Yun mentioned that this is a low number compared to a 5% benchmark at which the economy is sinking instead of growing. In other words, when unemployment is above 5%, the economy is considered to be sinking.
Wage growth is equal to home price growth, or rising at a similar rate. Good, buyers' purchasing power can keep up with the rising real estate prices.
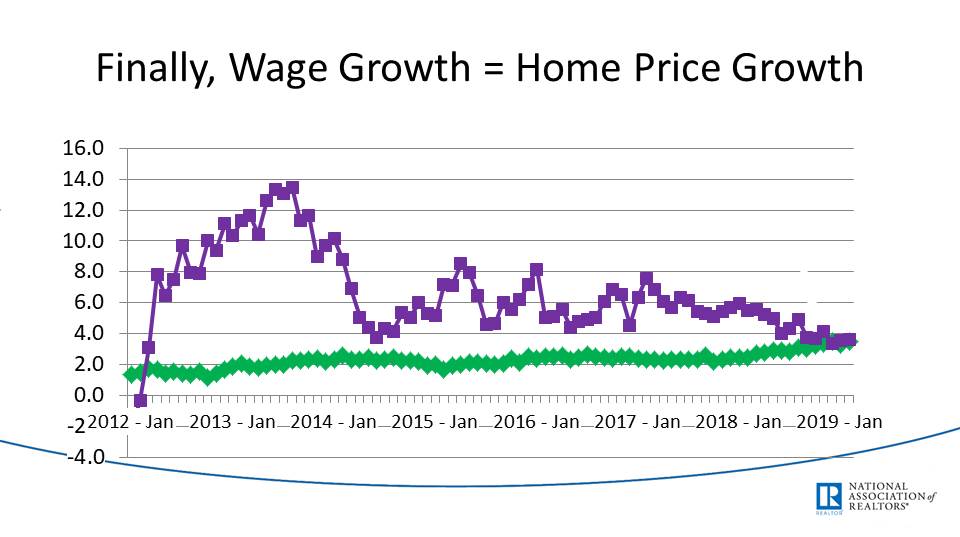
This graph shows % increases in wage growth (in green), versus % increases in home prices (in purple). Again, under the assumption, that the vertical axis is a % increase.
After-tax corporate profits are on the rise thanks to the new tax law. Companies are pocketing this cash and not reinvesting it, inflating their profits, allowing them to buy back stock, and thus increasing stock prices.
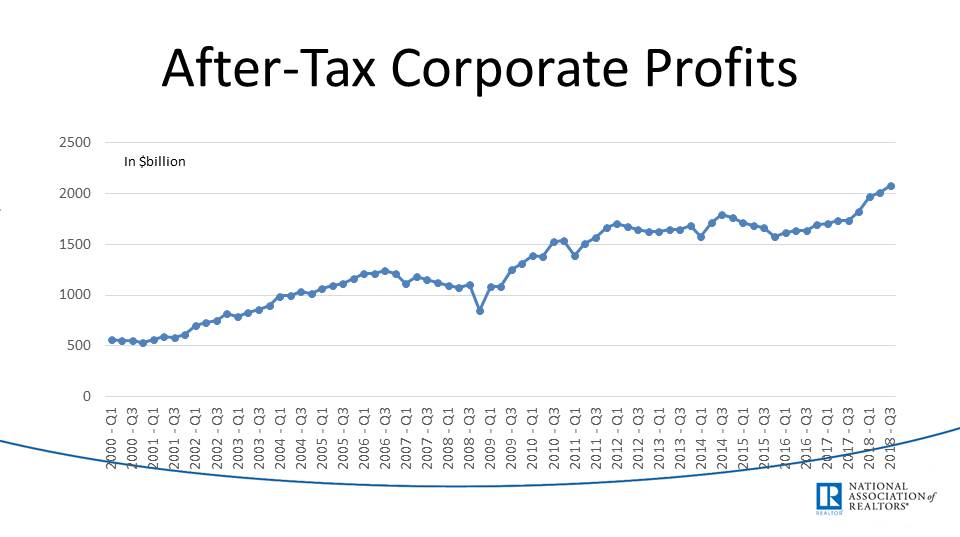
This speaks for itself: it shows after-tax corporate profits in billions of dollars over time.
Dow Jones is almost at its peak again. Dow Jones is a poor economic indicator in my opinion because it fluctuates with the biggest stocks, with the most money, able to artificially inflate their stock price. It's also manipulated by a board of humans who decide when a stock in the index no longer fits and can be replaced by something else that will continue to represent their interests.
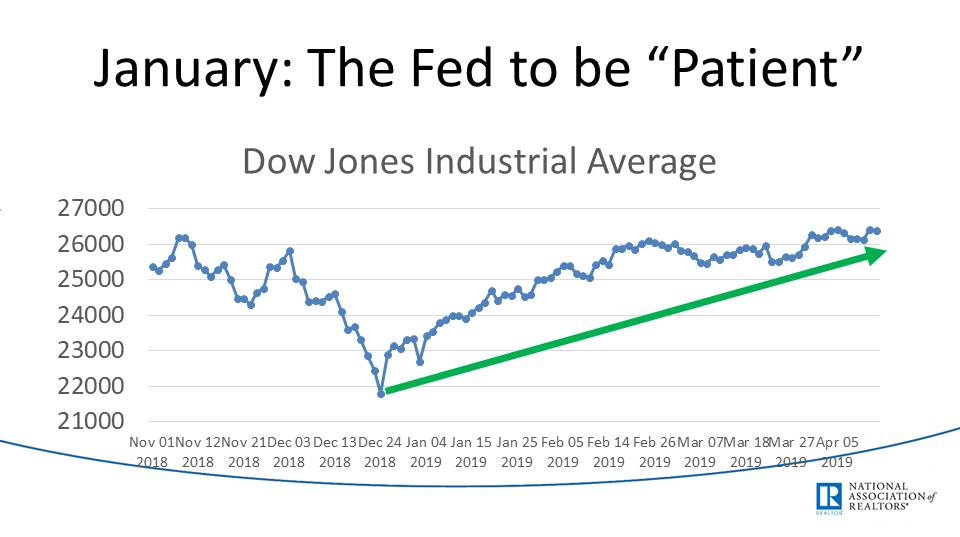
Dow Jones Industrial Average Chart over time.
Mortgage rates came down again after 2018 after a rising environment of rates. This is great to promote more buying. However, it's not an indicator of a positive economy, just a product of low Fed Interest Rates.
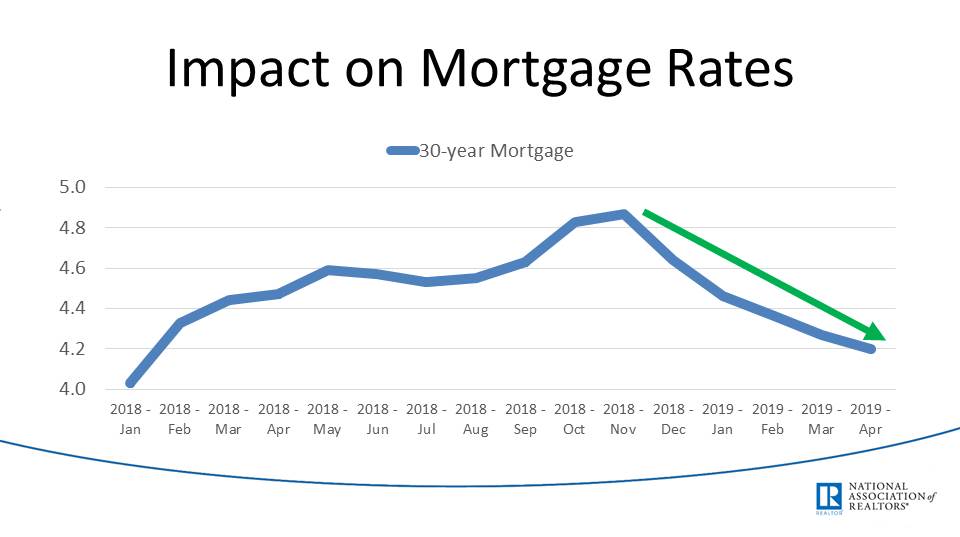
Mortgage interest rates over time.
Consumer confidence in ‘good time to buy is lower than in 2017, but on the rise slightly from 2018. This is something I would draw a different conclusion from since I see a negative trend in consumer confidence over the prior two years that this graph shows.
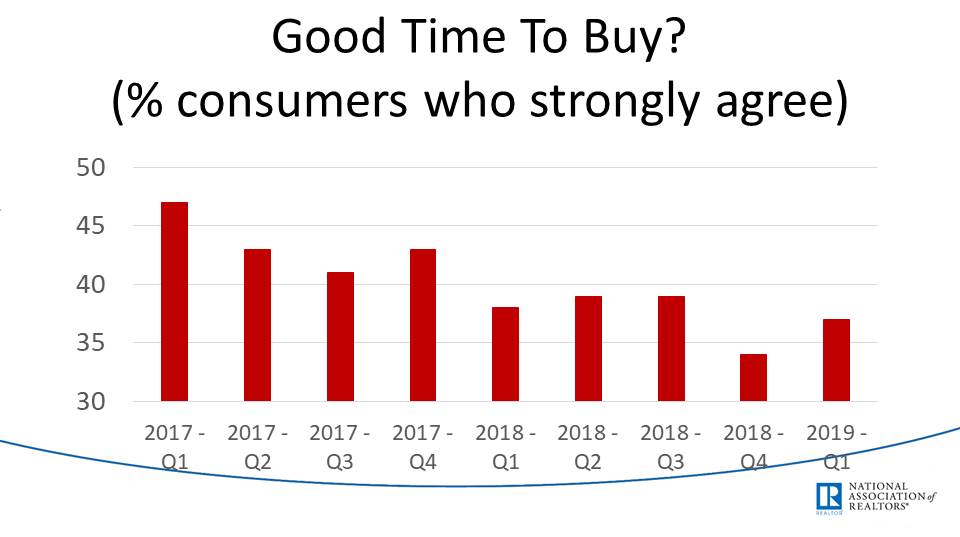
This shows the percentage of people who believe it is a good time to buy, quarterly.
In Connecticut (Not Looking So Good)
Total job creation in CT shows that there are about 100k more jobs than a decade ago during the foreclosure crisis.
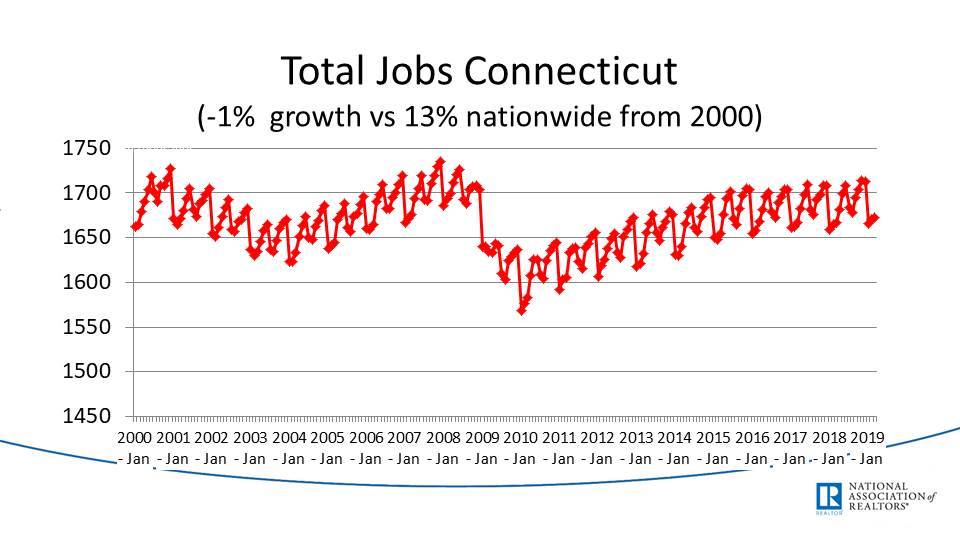
Total jobs in CT per month, likely in the thousands (so 1750 = 1,750,000)
The job growth in CT is -1% compared to 13% nationwide, whereas Texas has had 32% growth in the same period. So CT is growing much slower than Texas, but that is not surprising given the amount of new tech moving to that state.
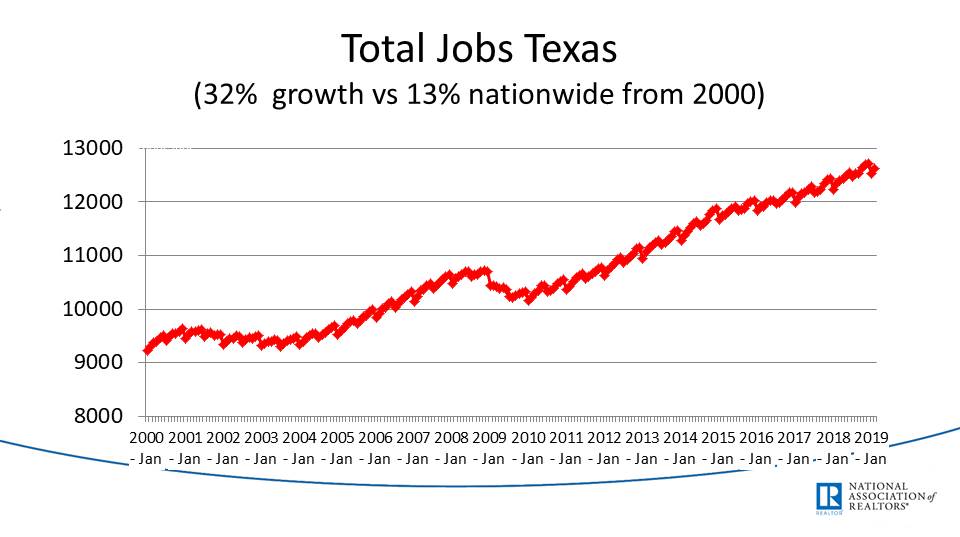
Total jobs in Texas, also in thousands.
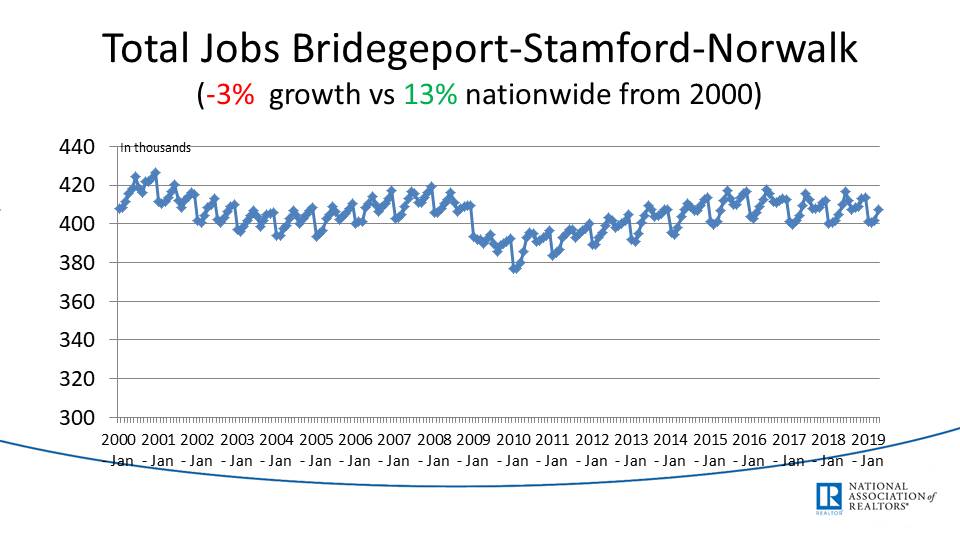
The same chart for our metro area shows even lower job growth in Fairfield County. Fairfield County is doing worse than the rest of the state.
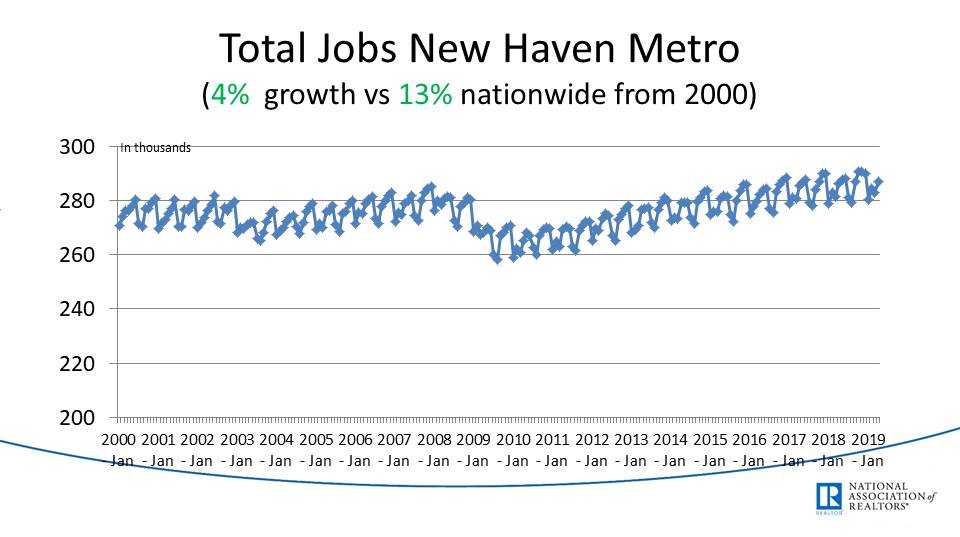
New Haven has had slightly better growth than CT or Fairfield County.
The Average Weekly Earnings are up in CT. The average weekly earnings increase in CT was $900 per week in 2007, $1100 as of the beginning of this year. I would like to see how this compares to the rest of the country.
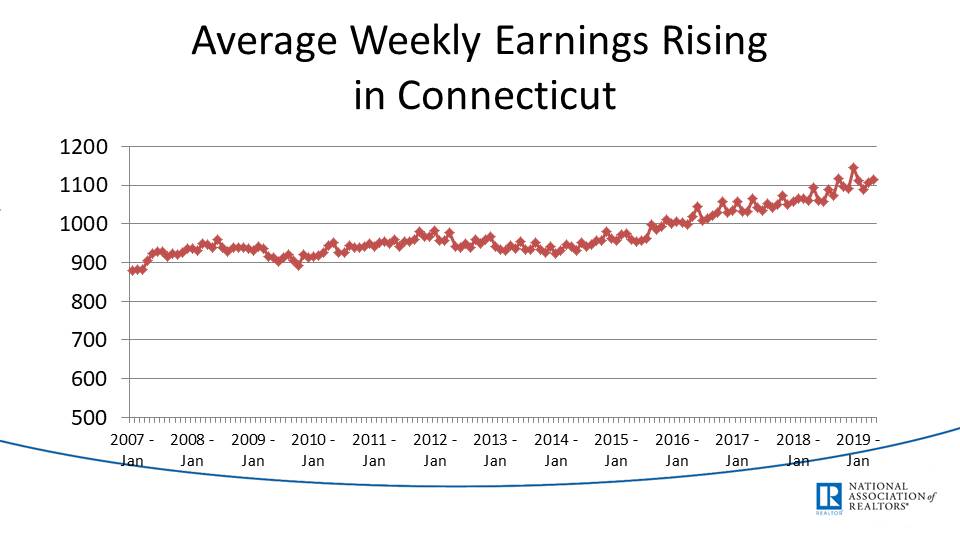
Average weekly earnings in CT over time.
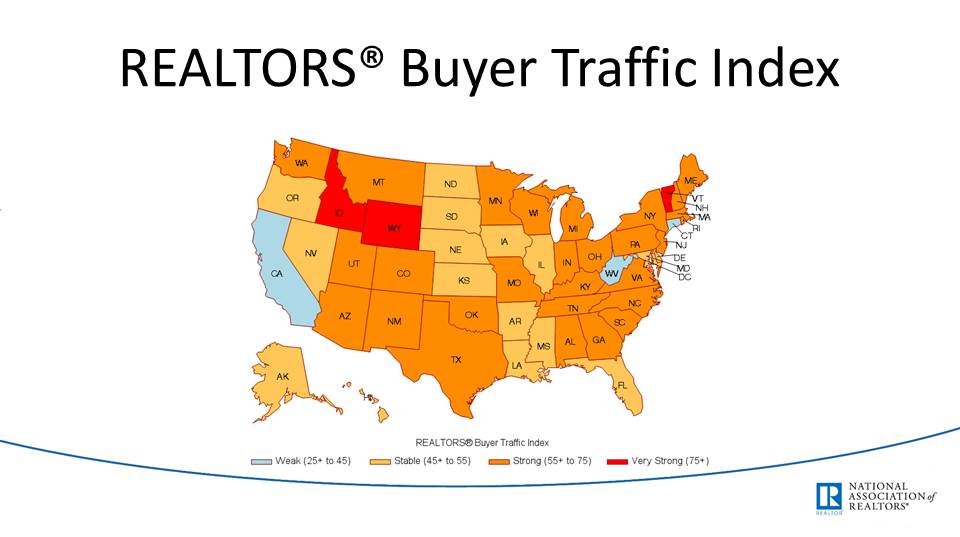
Connecticut, California, and West Virginia are the states with the lowest reported buyer traffic according to Realtors®.
State and Local Tax (SALT) Comparisons are also stark. This has been a hotly disputed issue in CT. With the change in governorship to Ned Lamont, from Dannel Malloy, taxes have been on the rise in the state. Suggestions for tolls and additional taxes by Ned Lamont are among these issues being contested locally.
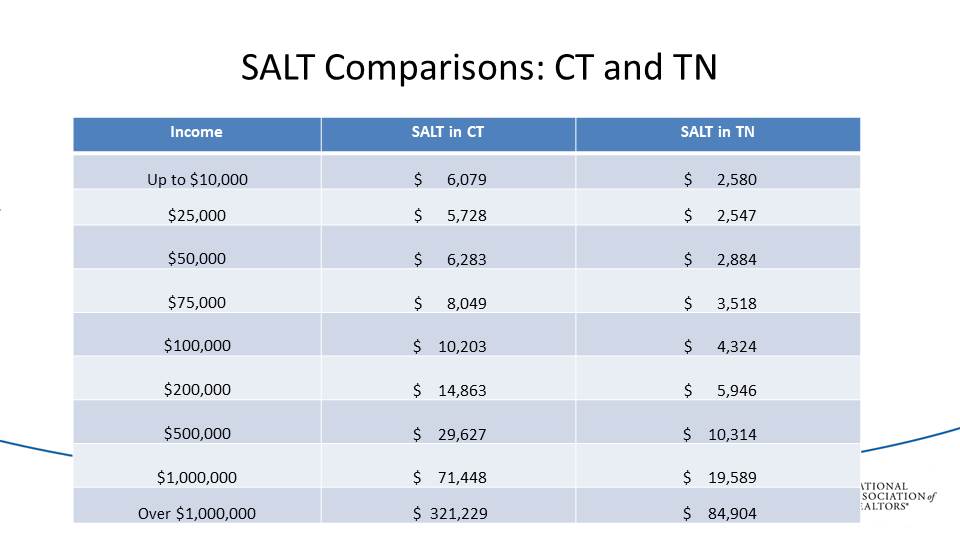
SALT = State And Local Taxes
The sentiment is Rising, What About Behavior?
Mortgage applications are up slightly, but I would believe they are down in CT and especially Fairfield County.
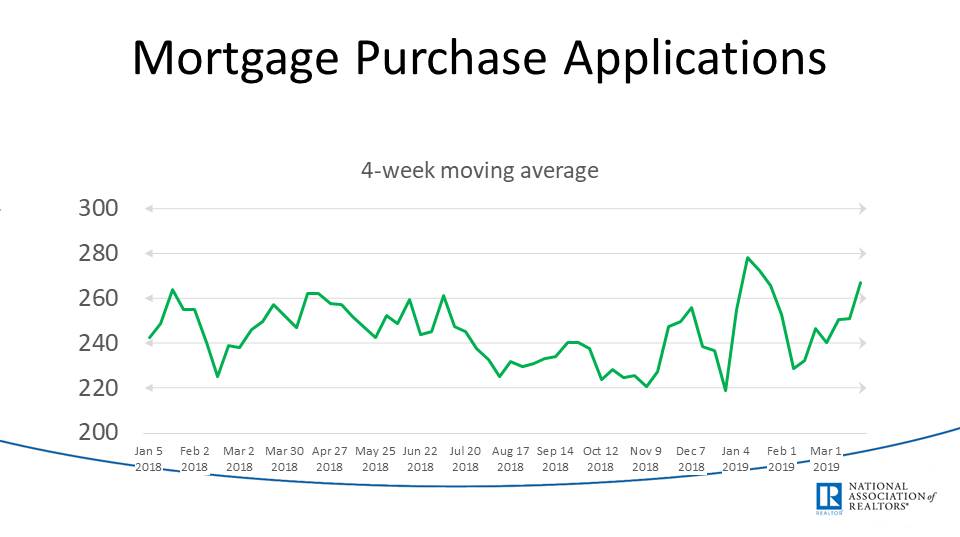
Total number of new mortgage applications, the point in time at which a buyer initiates a mortgage application, averaged across 4 weeks. This would be on the scale of thousands (000).
Home sales slid at end of 2018, but a fall in interest rates made Jan or march increase in 2019. Again, I would believe these are down in CT based on what I have seen locally (In Norwalk, for example, sales were 160 in Q1 2019 compared to 175 in Q1 2018, an 8.6% decrease in existing home sales.)
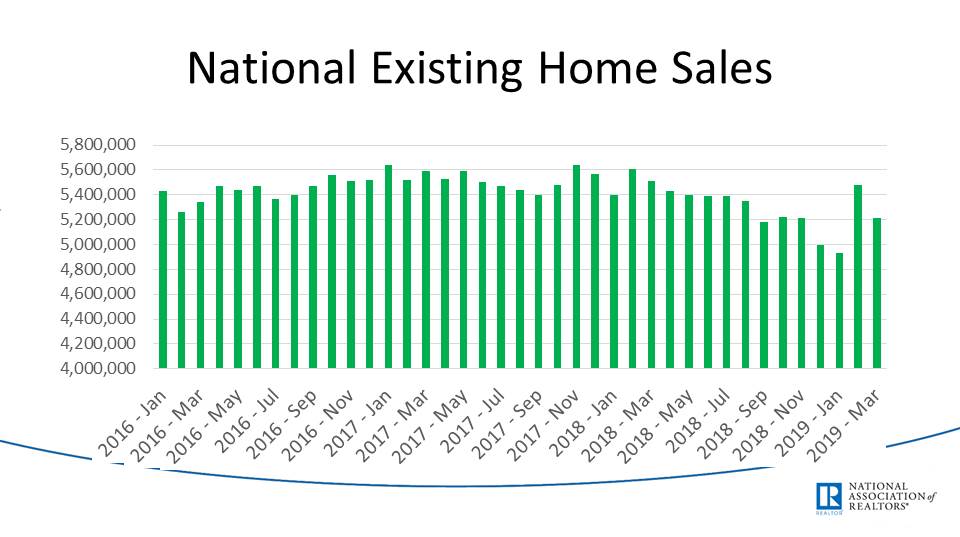
Existing home sales are those that are not new construction.
New home sales incrementally improving. Not enough local data to draw decisive conclusions for Fairfield County.
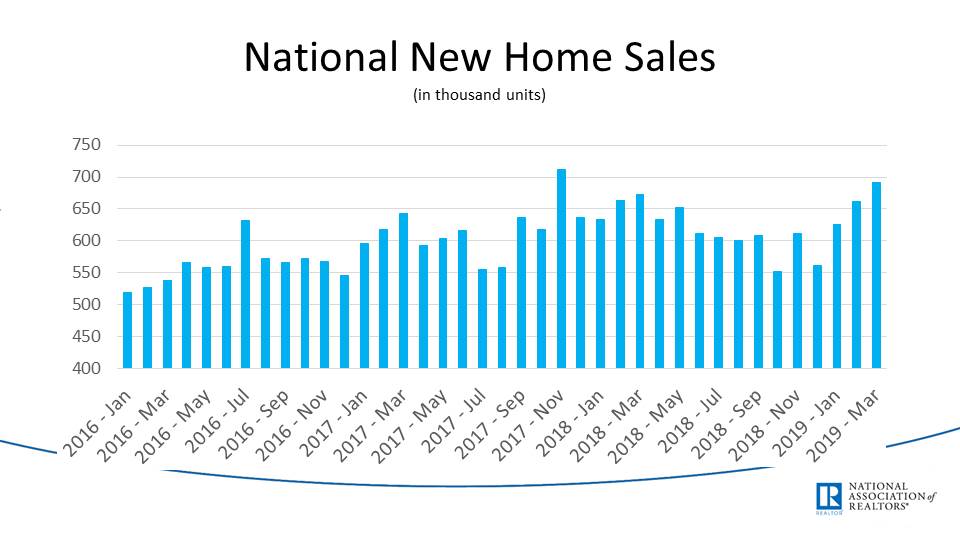
New construction home sales, in thousands.
The gap between new versus existing home prices has grown after the recession, but both trend lines are on the rise. This implies that existing home prices took a bigger hit after the recession as compared to new home sales which persisted a bit better. This type of trend might look different on a local level.
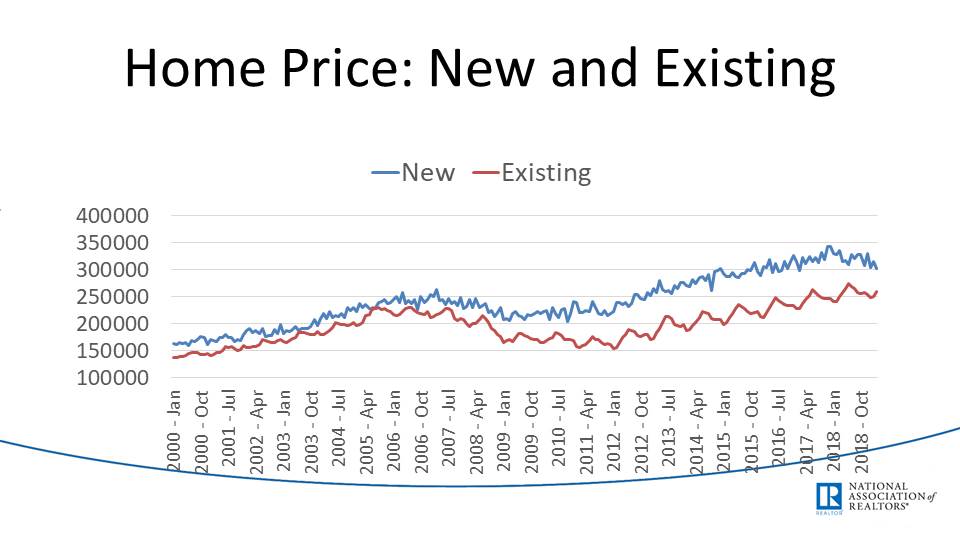
Comparison of new versus existing home prices in the U.S.
Inventory is increasing, but it was low in 2017 and 2018, country-wide. Dr. Yun described this as a positive change because no inventory means that home sales stagnate (no inventory to sell). However, I perceive an increase in inventory as a negative sign.
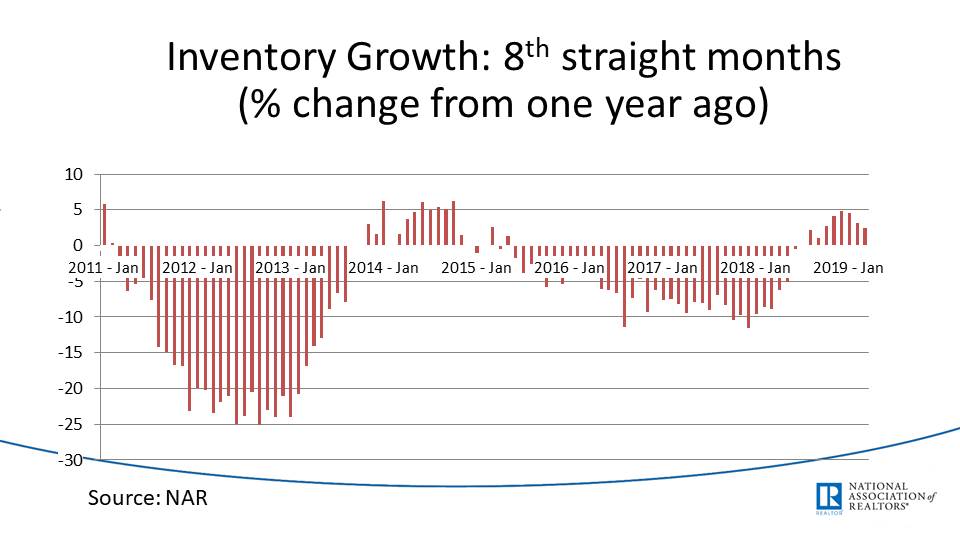
This shows a % change from a year ago in inventory levels. So, if inventory was at 100 in the same month last year, and 110 this year, the graph would show a 10% increase.
U.S. Housing Starts is up since 2009, but at a much slower pace than before 2009. So the market hasn’t recovered to pre-recession levels, as expected. However, the multi-family market has (all 2+ unit buildings).
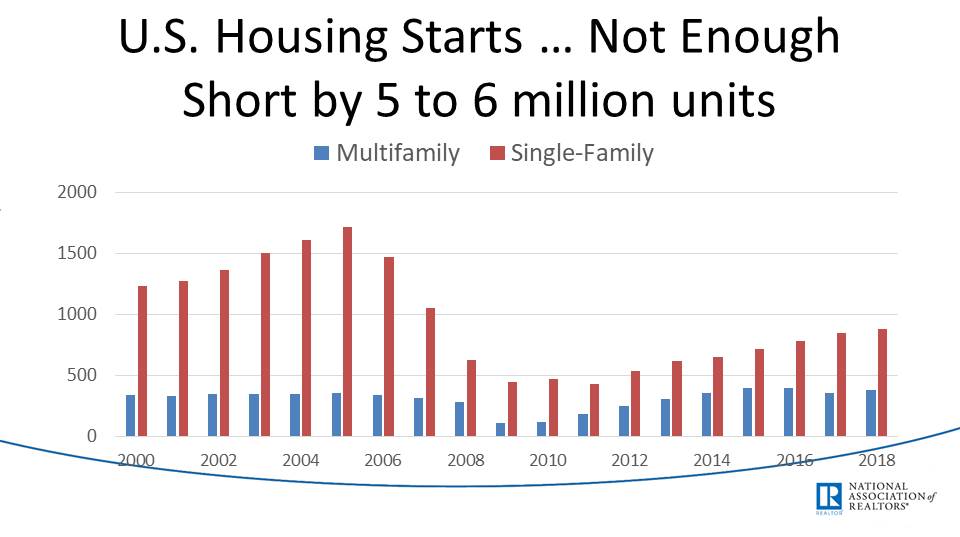
Housing Starts is the point at which a build breaks ground for a new project.
Dr. Yun also commented on the higher wealth of homeowners versus renters. Showing the below graph, he commented on how home prices have doubled since 1995 (tripled in Boston). Those bottom four are the main metro markets in CT (New London, New Haven, Hartford, Fairfield County).
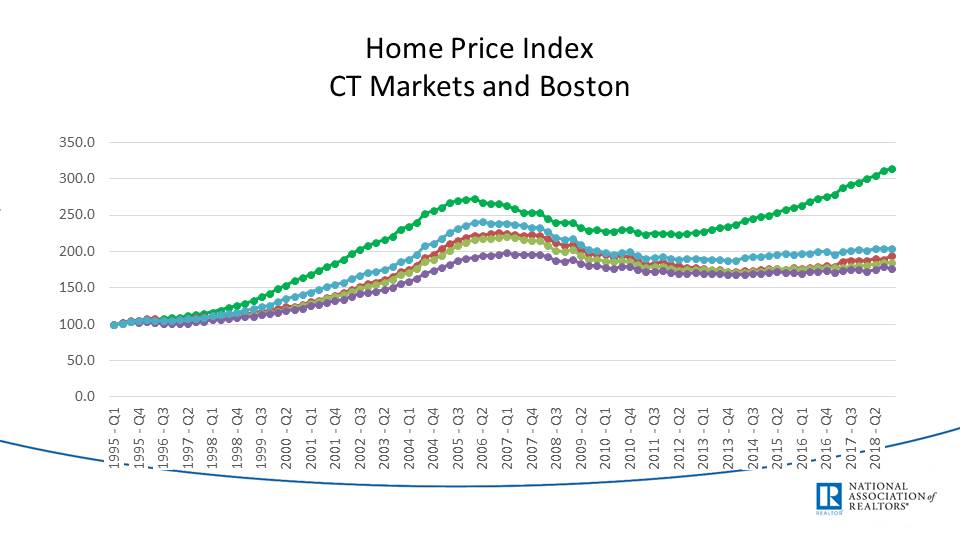
Home prices in CT and Boston as averages.
When showing the total assets versus the outstanding mortgage (i.e. wealth), it contributes to the point that the wealth of the world is in real estate.
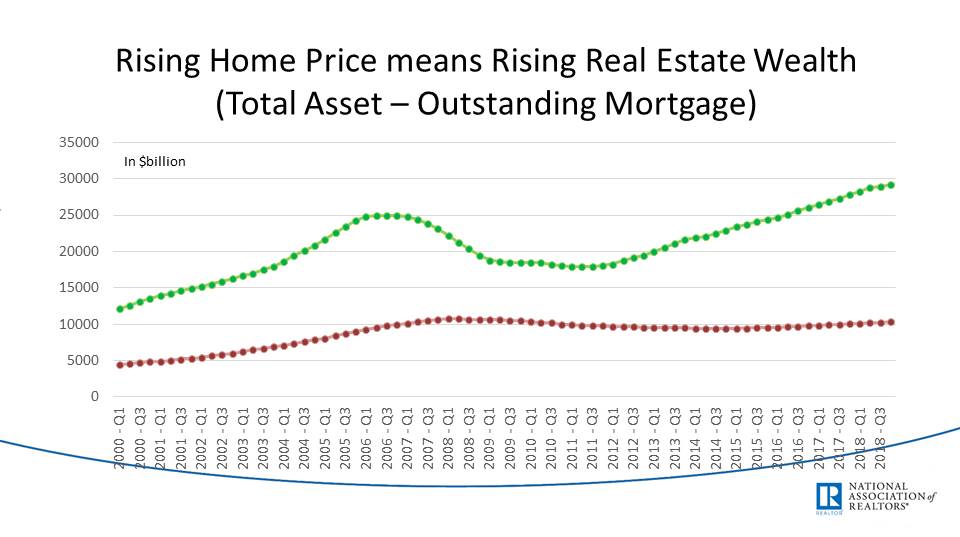
Total assets (green) versus outstanding mortgage amount (red). The area between these two lines is the wealth of America in real estate.
How About Behavior in Connecticut?
Single Family Starts in Connecticut are low. After the Recession, the amount of new construction in CT plummeted. This means builder sentiment had softened and stayed soft. This is expected during this type of crisis, but you would expect this number to rise ten years later. This might have to do with less expansion in CT because of the low demand for new housing. It could also be because of the saturation of buildable land. Either way, it’s not a great sign for CT.
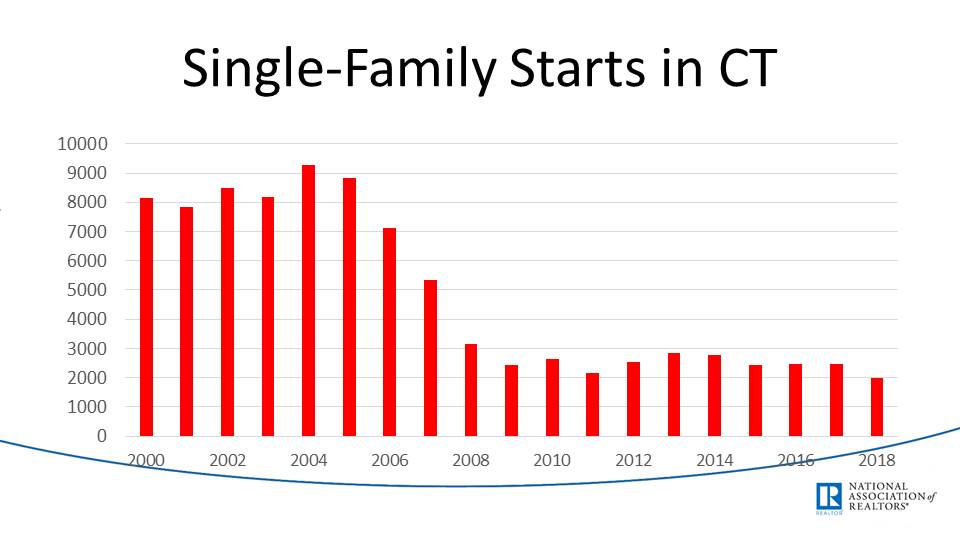
New single-family homes have begun construction in CT.
Multi-family Starts are relatively high, but about even for the last five years. This shows a tilt towards a renting society instead of an ownership society. (This includes 4+ unit buildings, so all apartment buildings are being built). Norwalk/Stamford are perfect examples of why I cannot dispute this statistic. Think of how many apartment buildings have been built in these past ten years. I would be willing to bet that more apartment buildings have been newly constructed than single-family homes (especially in small cities).
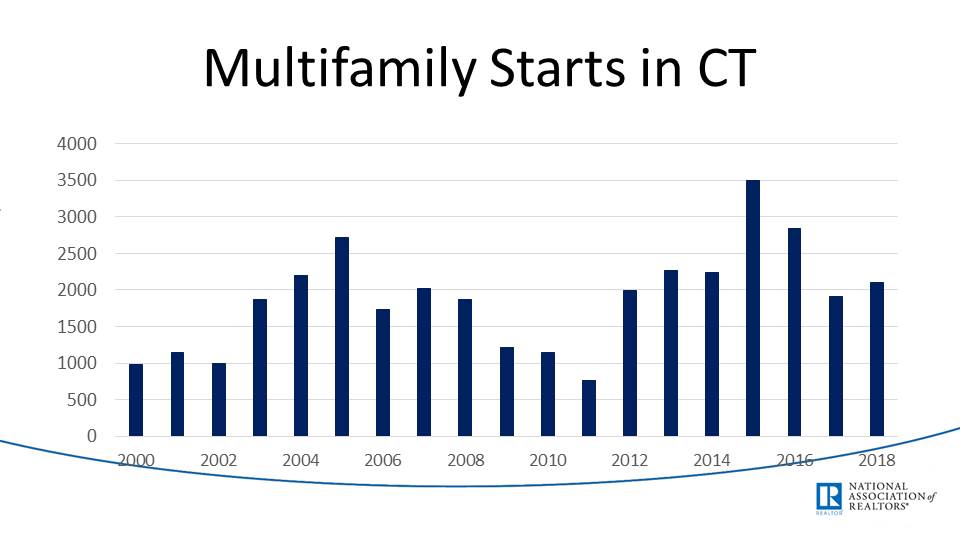
New Multifamily homes that have begun construction in CT, including any apartment buildings over 2 units.
What Dr. Yun Thinks:
Dr. Yun said that he sees homeowners staying longer, slower economic growth, and home prices outpacing income growth. If we took action to remove local restraints such as zoning laws and the permitting process, we might see more efficient construction. He also thinks more kids should go to trade schools so we have more skilled labor. We might increase federal spending for assisting in the creation of jobs that have to do with home construction. Local economies might give tax incentives to develop and re-develop. These things will all help with the issues described above.
One interesting point he brought up: Could fixing the student debt crisis be the solution to the housing market? In other words, eliminating the debt for millions of students would allow them more freedom to buy homes instead of trying to pay off debt.
Would a gap year after high school where students aren’t sure about whether to attend a college help guide them towards a trade school instead of college? His idea specified having them make good money in construction (higher paid employees) for that gap year to make a good chunk of money to help pay for college, but also give him/her a chance to think about the decision to go to college.
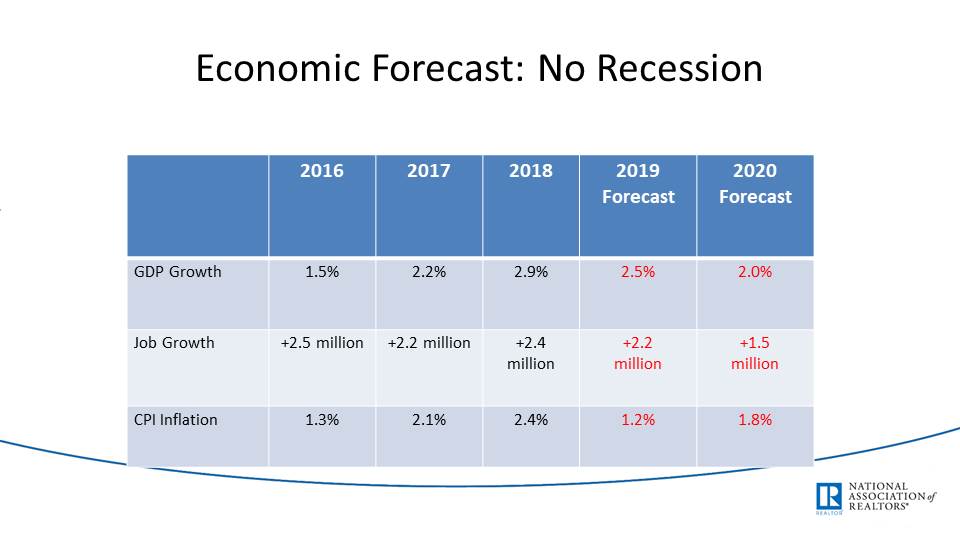
Economic Forecast: No Recession
- We will probably see 2% GDP (Gross Domestic Product) in 2020, and 2.5% in 2019. He commented on the inaccurate GDP numbers quoted by the president. Data can be manipulated to look positive, in that case with a high monthly GDP number. If the monthly number is high, it will be compared to a yearly increase in GDP, thus misleading those who are reading/listening.
- Job growth will decrease.
- CPI (Consumer Price Index, which looks at the movement of an average set of goods purchased in the U.S.) inflation goes from 1.2% to 1.8% in 2019-2020.
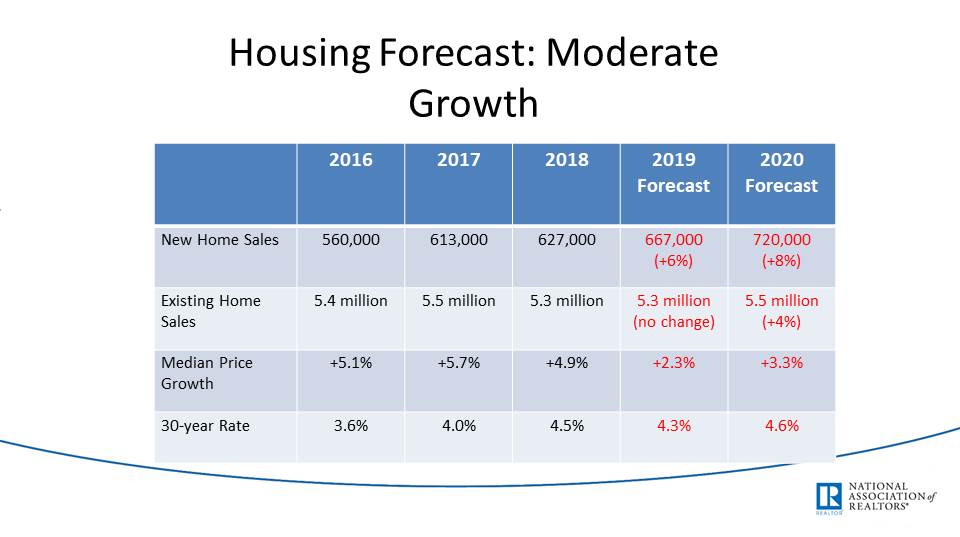
Housing Forecast: Moderate Growth
- New home sales and construction rising.
- Existing home sales have no change, a slight increase (4%) from 2019.
- Median price growth is down from 2016/2017/2018 but up from 2019-2020.
- Interest rates are slightly higher.
What I Think
Given Dr. Yun's conclusion was ‘No Recession’, I am still skeptical about how this came about. When he says that homeowners are staying longer (less buying and selling), economic growth is slower, and home prices are outpacing income growth, these all point to negative conclusions. He shows forecasts for both the economy and the housing market as negative as compared to last year’s numbers. He even alluded to student debt as a major issue which also furthers the point that the housing market is struggling (for a different reason).
Other factors that point to a slowing economy or struggling workforce are things such as the current trade war, the continued loss of manufacturing throughout the country, automation of the workforce (tied to loss of manufacturing), and climate change. Though we don’t see the direct impact of these factors yet, they are coming in the future, and may drastically change the market as we know it. I believe the housing statistics provided cannot be analyzed independently from the other factors that affect the economy, including these and other political, foreign, and financial issues we contend with. It’s an analysis inside of a vacuum, and we all know how intertwined these issues are, especially with current political uncertainty.
I suppose it’s prudent for the chief spokesperson that represents the interests of Realtors® in the United States to predict positivity in our market. But, it’s important to prepare for the worst-case scenario, in my opinion.
Dr. Yun came and delivered data with a conclusion that I believe is false. In all reality, there are as many predicting a recession as there are predicting no recession. The question is, though whose eyes are you looking to make that determination? For NAR, spinning the message towards positivity is essential to the model. If we predict the real estate market will go down, more people will stop buying it’s a self-fulfilling prophecy. For someone who has shorted the stock market, they might find it important to proclaim a negative market.
I come from a local perspective and don’t consider myself to be an expert at predicting trends in the national market. I can tell you what I am seeing locally is negative to the real estate market, but my audience isn’t large enough to influence people’s behavior. So, in that department, I have to defer to Dr. Yun and his team of capable experts to conclude on a broader scale. However, I do find it important that other major issues are part of the conversation. In other words, just because I find his conclusions to be misleading, it doesn't mean he is completely wrong. I just believe that these other major factors aren't discussed (maybe due to lack of time, or inability to quantify the effect of these factors) and should be.
Maybe we won’t have a recession, but we will see a downswing in the real estate market in the short term, the next five years. I hope he is right and I am wrong.
Should you have questions, or want to debate any of the points in this blog, please comment below or contact Joe directly at [email protected].